Pseudo-random
number generator
Introduction
To accomplish computational tests about the
multi-objective shortest path problem, a generator of random or pseudo-random
number is needed. We have used our random generator code (randNet) to produce the instances of
this data base. This web page reports some statistical analysis of the
pseudo-random numbers obtained with this code. To know more about pseudo-random
and true random number you may follow this link: http://www.random.org/essay.html
Theoretical
results
Let X,
Y and Z be random discrete variables following a discret uniform
distribution in the set {1, ..., 100}, then:
- P(X = i) = 1/100 = 0.01,
∀ i ∈ {1,
..., 100}
- E(X) = 101/2 = 50.5
and V(X) = 9999/12 = 833.25
- P(X = Y) = 1/100 = 0.01
and P(X < Y) = P(X > Y) = 99/200 = 0.495
- P(X = Y = Z) = 1/10000 =
0.0001 and P(X < Y < Z) = P(X > Y
> Z) = 0.1617
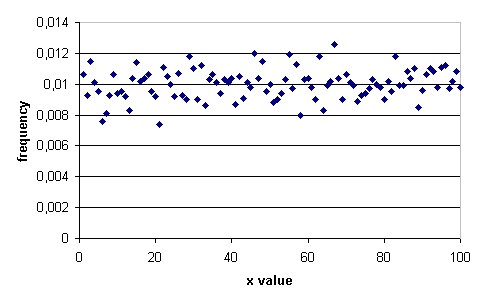
Statistical
study about the randNet generated values
We consider
a sample with 10 000 elements obtained with our code (click here
to download the sample file).
Let xi
be ith value of this sample. Then:
(see the figure in the right hand).
|
(click on graphic thumbnail to see a large
image) |
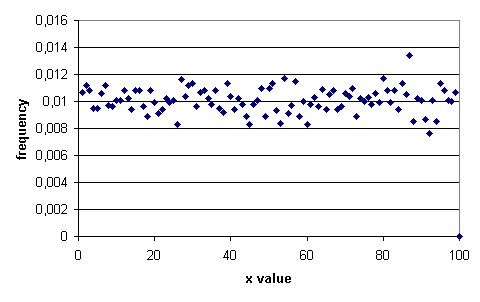
Statistical
study about the true random values
We consider
a sample with 10 000 elements obtained from http://www.random.org/nform.html
(click here
to download the sample file).
Let xi
be ith value of this sample. Then:
|
(click on graphic thumbnail to see a large
image) |